"Post every day" is the oldest advice in online video, and the most tiring. It comes with a threat attached: miss a week and the algorithm forgets you. Most of the evidence offered for it is a chart of big channels that post a lot, which can't tell you whether they're big because they post a lot or post a lot because they're big.
So we measured it within channels. Using the open YouNiverse dataset, we compared each of 131,036 English YouTube channels with itself, month by month, from 2016 to 2019, before Shorts: how many videos it posted, and how many views and subscribers it gained. We also looked at about 48,000 breaks, at regular schedules and at 164 channels' Shorts in 2025–2026, next to what the platforms, the largest vendor studies and creator surveys say. Our measurements are labelled as ours, and all are correlations; platform and vendor figures are their claims, each linked to its source.
Key findings
- 1In our sample of 131,036 English YouTube channels (2016–2019, channels that had more than 10,000 subscribers by October 2019), a month in which a channel posted twice as many videos went with about 25% more views and 24% more new subscribers than its other months. Not 100% more.
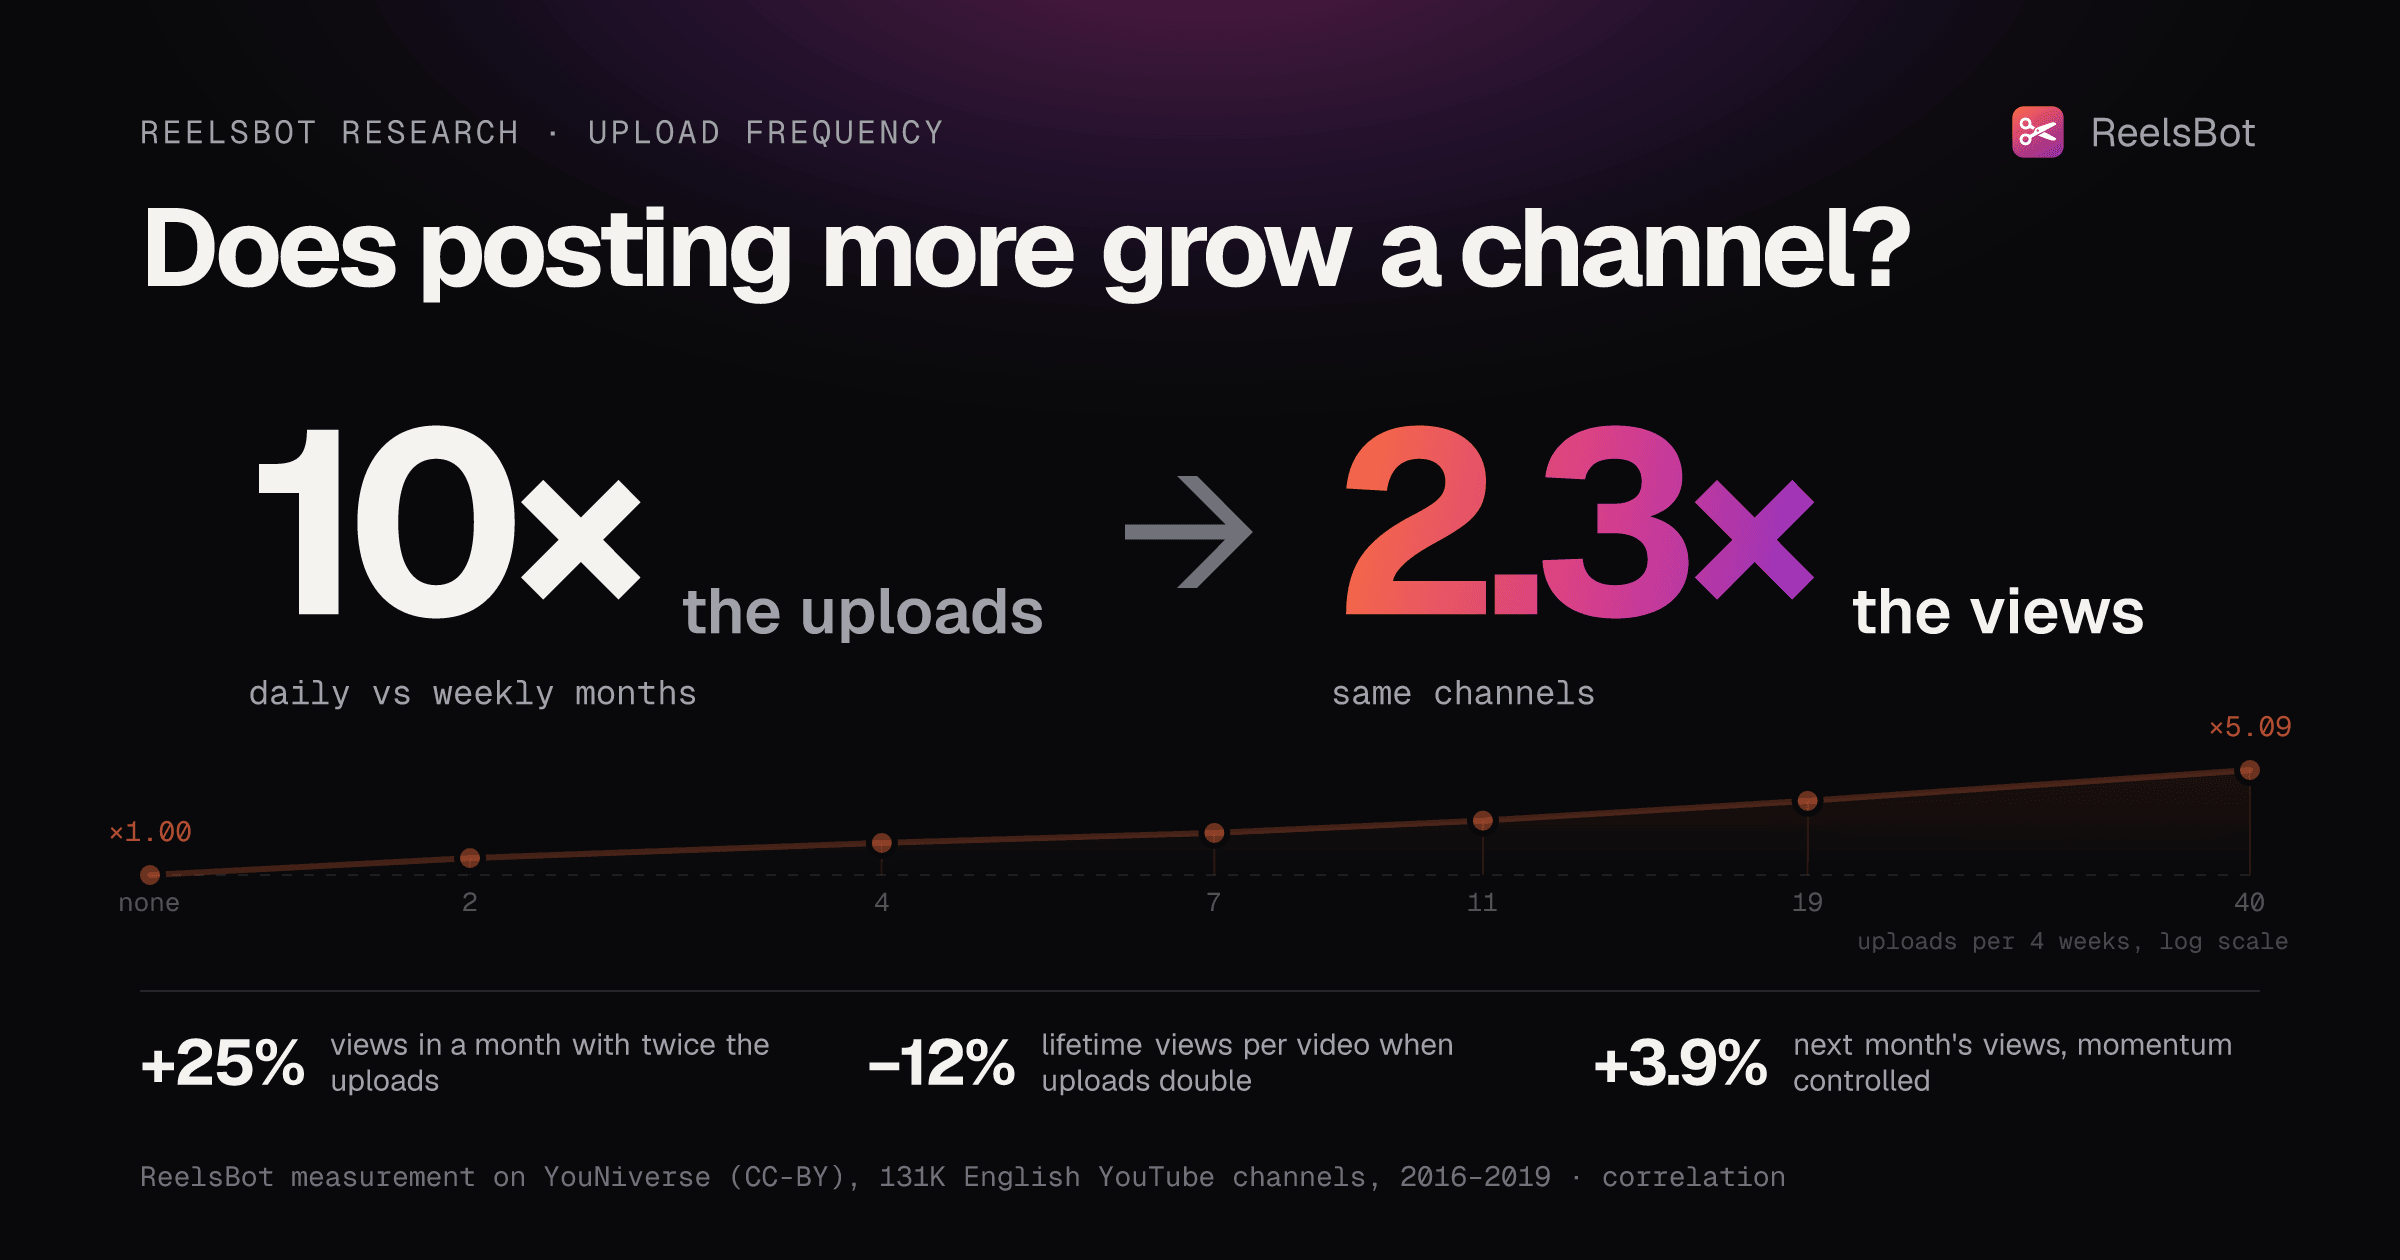
- 2Returns shrink fast. Months with a video a day or more went with 5.09 times the views of the same channel's months with no uploads, against 2.25 times for about one a week: 10 times the uploads for 2.3 times the views.
- 3Each video got less. In a month with twice the uploads, each video ended up with about 12% fewer lifetime views.
- 4Part of the link runs the other way. Next month's uploads "predict" this month's views about a third as strongly as this month's uploads do. With a channel's momentum controlled, doubling uploads goes with only +3.9% views and +5.5% new subscribers the following month.
- 5In the first four weeks of a break of four weeks or more, weekly views ran 19% below similar channels that kept posting. The comeback mattered more: in the 12 weeks after returning, channels back at 90% or more of their old pace ran 5% above comparable channels, those back at under half 25% below.
- 6Among channels posting one or two videos a week, the most regular third grew subscribers 54% over the year, the most irregular third 34%. But last year's regularity didn't predict this year's views once last year's views and both years' uploads were controlled.
- 7In our sample of 164 channels' Shorts (January 2025 to October 2026), busier stretches didn't lower views per Short (elasticity +0.05 ± 0.05).
- 8Platforms don't back the lore. YouTube's Help Center says growth in views across uploads "is not correlated with time between uploads", while listing uploading less often among reasons recommendation traffic drops. TikTok's "post 1–4 times per day" was 2021 advice to advertisers. Only Snap writes a cadence rule down, for monetization. Still, 75% of 1,007 US creators in Patreon's survey said platforms punish those who aren't constantly publishing.
+25%
Views gained in a month with twice the channel's usual uploads, 131K channels, 2016–2019
ReelsBot measurement
2.3×
Views for 10× the uploads: daily months vs weekly months, same channels
ReelsBot measurement
−12%
Lifetime views per video when a month's uploads double, 26.8M videos
ReelsBot measurement
+3.9%
Next month's views per doubling of uploads, with the channel's momentum controlled
ReelsBot measurement
Most channels post less than you'd think#
Start with what channels do. Across the 85,637 channels in our sample with a full year of data from October 2018 to September 2019, the median channel posted 0.6 videos a week. 44.1% posted, but less than once every two weeks (2.6% posted nothing), and only 3.4% averaged a video a day or more.
Most channels posted less than once a week
% of channels by average uploads per week, Oct 2018–Sep 2019, 85,637 English YouTube channels with more than 10k subscribers in Oct 2019
| Label | Value |
|---|---|
| None | 2.6% |
| Under 0.5 | 44.1% |
| 0.5–1 | 16.9% |
| 1–2 | 16.1% |
| 2–3.5 | 9.6% |
| 3.5–7 | 7.4% |
| 7 or more | 3.4% |
 ReelsBot
Pew Research Center saw the same among bigger channels: collecting every video posted by 43,770 channels with at least 250,000 subscribers in the first week of 2019, it found that "just 10% of the popular channels … produced 70% of all the videos". Daily posting is what a small minority does, even among channels that made it.
Posting more goes with more views, but not in proportion#
Comparing channels that post a lot with channels that post little mostly compares different channels. So we compared each channel with itself: we split its history into four-week periods (we'll call them months) and asked how views and subscribers gained in a month moved with the videos posted in it, after removing the channel's own average and any platform-wide swing in that month.
The answer is an elasticity of 0.32 for views and 0.31 for new subscribers: a month with twice a channel's usual uploads went with about 25% more views and 24% more new subscribers, not twice as many. Across our robustness checks (only 2018–2019, weekly instead of monthly, without music channels, only channels already past 10,000 subscribers), the views figure stayed between 0.24 and 0.35. Grouping months by how much a channel posted shows how fast the curve flattens.
Ten times the uploads, 2.3 times the views
Views gained in a month vs the same channel's months with no uploads, by uploads that month (median in brackets), 2016–2019
| Label | Value |
|---|---|
| None (0) | ×1.00 |
| Under 1 a week (2) | ×1.66 |
| ~1 a week (4) | ×2.25 |
| 1.5–2 a week (7) | ×2.64 |
| 2–3 a week (11) | ×3.12 |
| 3.5–7 a week (19) | ×3.89 |
| Daily+ (40) | ×5.09 |
Source: ReelsBot measurement on YouNiverse (CC-BY), 4.4M channel-months, 133,018 channels
One likely reason: views gained in a month include views of the back catalogue, which keep coming whether or not anything new goes up. Another is in the next section.
The link was strongest for gaming channels (41% more views for twice the uploads) and weakest for music, education and nonprofits, whose songs, lessons and campaigns may keep being watched long after release.
Gaming channels gained most from posting more, music least
% more views gained in a month with twice the channel's usual uploads, by YouTube category, 2016–2019
| Label | Value |
|---|---|
| Gaming | +41% |
| Comedy | +33% |
| People & Blogs | +29% |
| Entertainment | +29% |
| News & Politics | +29% |
| Sports | +26% |
| Howto & Style | +22% |
| Film & Animation | +20% |
| Autos & Vehicles | +20% |
| Science & Technology | +18% |
| Travel & Events | +18% |
| Pets & Animals | +17% |
| Education | +15% |
| Music | +12% |
| Nonprofits & Activism | +12% |
Source: ReelsBot measurement on YouNiverse (CC-BY); category from channelcrawler
Each video gets less#
If twice the uploads goes with only a quarter more views, views per video must fall. We checked directly on 26.8 million videos uploaded from January 2017 to August 2019, using each video's lifetime views when the dataset was crawled in late 2019. Within a channel, videos from months with twice the uploads ended up with about 12% fewer views each.
Videos from busier months got fewer views each
Lifetime views per video, % of the same channel's videos from months with about one upload a week, by uploads that month, uploads 2017–2019
| Label | Value |
|---|---|
| Under 1 a week | +8.8% |
| ~1 a week | baseline |
| 1.5–2 a week | −7.7% |
| 2–3 a week | −14.2% |
| 3.5–7 a week | −22.4% |
| Daily+ | −32.1% |
Source: ReelsBot measurement on YouNiverse (CC-BY), 26.8M videos, 135,823 channels
There are two readings, and the data can't separate them: videos from the same channel may compete for the same viewers, or a creator who doubles their output spends less time on each video.
Part of the link runs the other way#
Even within a channel, a busier month isn't a controlled experiment. A creator who's on a roll, landed a sponsor or picked a hot topic may post more because things are going well; one in a bad patch may post less and make weaker videos at the same time. Either would make uploads and growth move together without one causing the other.
One check: do next month's uploads "predict" this month's views? They can't cause them, so any link there is momentum, anticipation or shared circumstances. In our model, next month's uploads went with this month's views at about a third of the strength of this month's own uploads.
Next month's uploads 'predict' this month's views
Association of a month's views gained with uploads in the previous, same and next month (coefficient on log uploads), within channels, 2016–2019
| Label | Value |
|---|---|
| Last month's uploads | 0.25 |
| This month's uploads | 0.29 |
| Next month's uploads | 0.09 |
Source: ReelsBot measurement on YouNiverse (CC-BY), 4.2M channel-months
Growth also goes with more posting afterwards, though modestly: a channel whose views doubled last month posted about 3% more this month. To get closer to the effect of posting itself, we asked: given how a channel did this month and last, does posting more this month go with more growth next month? It does, but much less: doubling uploads went with 3.9% more views and 5.5% more new subscribers the following month.
Controlling for momentum leaves a much smaller link
% more views and new subscribers per doubling of a month's uploads, same month vs next month with this and last month's growth controlled, 2016–2019
| Label | Value |
|---|---|
| Views, same month | +25% |
| New subscribers, same month | +24% |
| Views, next month | +3.9% |
| New subscribers, next month | +5.5% |
Even that +3.9% isn't clean, though it stays positive in every channel-size band and category we checked. It is consistent with posting more helping a little, and a long way from "post twice as much, grow twice as fast".
What a break costs#
The fear behind daily posting is the break. We found about 48,000 first breaks: four weeks or more without an upload, by channels that had posted in at least 8 of the previous 12 weeks. Most were short (68% lasted 4–7 weeks), and 94.6% of the channels came back before the data ends. To separate the break from whatever else was going on, we compared each channel with similar channels (same size, equally active before) that didn't stop.
Views dropped during a break and settled lower after it
Median weekly views, % of the channel's own pre-break level and of similar channels that kept posting, by weeks from the start of a 4–7 week break, 2016–2019
| Series | x | y |
|---|---|---|
| Vs own pre-break level | -12 | 96% |
| Vs own pre-break level | -8 | 98% |
| Vs own pre-break level | -4 | 97% |
| Vs own pre-break level | -1 | 95% |
| Vs own pre-break level | 0 | 88% |
| Vs own pre-break level | 1 | 82% |
| Vs own pre-break level | 2 | 78% |
| Vs own pre-break level | 3 | 77% |
| Vs own pre-break level | 4 | 80% |
| Vs own pre-break level | 6 | 86% |
| Vs own pre-break level | 8 | 88% |
| Vs own pre-break level | 12 | 88% |
| Vs own pre-break level | 16 | 89% |
| Vs own pre-break level | 26 | 90% |
| Vs own pre-break level | 52 | 90% |
| Vs similar channels still posting | -12 | 102% |
| Vs similar channels still posting | -8 | 101% |
| Vs similar channels still posting | -4 | 98% |
| Vs similar channels still posting | -1 | 94% |
| Vs similar channels still posting | 0 | 88% |
| Vs similar channels still posting | 1 | 81% |
| Vs similar channels still posting | 2 | 78% |
| Vs similar channels still posting | 3 | 77% |
| Vs similar channels still posting | 4 | 80% |
| Vs similar channels still posting | 6 | 85% |
| Vs similar channels still posting | 8 | 86% |
| Vs similar channels still posting | 12 | 86% |
| Vs similar channels still posting | 16 | 86% |
| Vs similar channels still posting | 26 | 85% |
| Vs similar channels still posting | 52 | 82% |
Across all breaks, weekly views in the first four weeks ran 19% below the comparison channels (new subscribers 15% below), and in the 12 weeks after returning they were still 13% behind. Longer breaks went with bigger gaps after the return, from 11% for 4–7 weeks off to 29% for six months or more. But channels that took long breaks also came back slower. Split by the comeback instead, the picture changes.
After a break, coming back at full pace was what mattered
Weekly views in the 12 weeks after a 4+ week break, % of comparable channels that kept posting, by how much of the old upload cadence a channel resumed, 2016–2019
| Label | Value |
|---|---|
| Under 50% | 75% (21,164 breaks) |
| 50–90% | 91% (11,210 breaks) |
| 90% or more | 105% (11,281 breaks) |
Most channels didn't come back at full pace: in their first 12 weeks back, returners posted a median 52% of their old weekly uploads, and only 41% got weekly views back to the pre-break level. In our data the costly part was less the time away than the slow return.
YouTube's own statements are more optimistic. Its Help Center says: "We studied thousands of channels that took a break and found no correlation between break length and changes in views", and adds that "it may take some time to 'warm up' your audience again". In 2019 then-CEO Susan Wojcicki wrote that YouTube's product team looked at six years of data "across millions of channels and hundreds of different time frames for breaks" and found that "on average, channels had more views when they returned than they had right before they left". That needn't contradict ours, where the comeback mattered more than the break's length. But YouTube hasn't published its method, sample or which views it counted, so we can't line its results up with ours. Ours is from 2016–2019, compares against channels that kept posting, and only covers channels that reached 10,000 subscribers.
Does consistency matter?#
"Be consistent" is the softer version of "post daily", and it has an official origin. In 2011 YouTube's Creator Playbook post said: "A typical frequency we've seen among successful YouTubers is a video a week." To test regularity apart from volume, we took channels posting about the same number of videos in a year and split them by how evenly spaced their uploads were.
Regular schedules went with faster growth in the same year
Median subscriber growth, Oct 2018–Sep 2019, channels posting 52–103 videos that year, by how evenly their uploads were spaced
| Label | Value |
|---|---|
| Most regular third | +54% (92% of weeks) |
| Middle third | +45% |
| Most irregular third | +34% (54% of weeks) |
Source: ReelsBot measurement on YouNiverse (CC-BY), 15,624 channels in this band
That looks like a strong case for consistency, and it held when we dropped channels with any four-week gap. But it's measured in the same year as the growth, so it has the same problem as before: a channel that's doing well finds it easier to keep a schedule. The stricter test is whether last year's regularity predicts this year's views, with last year's views and both years' uploads controlled. It doesn't: −0.3% per standard deviation, statistically indistinguishable from zero. Posting on the same weekday did carry over, weakly: a 30-point higher share of uploads on one weekday went with about 5% more views the next year.
A vendor study of 2025–2026 uploads points the same way at the level of single videos. OverseerOS, which sells YouTube analytics, looked at 8,942 long-form uploads from 270 channels and found that videos released on schedule performed at 1.00 times their channel's median, against 1.17 times for videos that came after more than twice the usual gap.
Shorts in 2025–2026: no per-Short penalty#
All of the above predates Shorts. For a current check, we reused two Shorts samples from earlier posts in this series: for 164 channels we could count the Shorts in stretches of known length (median 30 days) from January 2025 to October 2026 (165 channels going back to 2023), and compared each channel's busy stretches with its quiet ones.
Posting more Shorts didn't lower views per Short
Median views per Short in a stretch, % of the channel's typical stretch, by Shorts posted per week in it, 165 channels, stretches from 2023 to Oct 2026
| Label | Value |
|---|---|
| Under 1 a week | 101% (38 channels) |
| 1–2 a week | 100% (59 channels) |
| 2–4 a week | 100% (80 channels) |
| 4–7 a week | 100% (90 channels) |
| 1–2 a day | 100% (91 channels) |
| 2+ a day | 100% (53 channels) |
Source: ReelsBot measurement on public Shorts listings collected 26 Oct 2026
In this small sample, the long-form pattern of each video earning less didn't show up: a Short posted in a busy week did about as well as one in a quiet week. These samples have no subscriber history, so we can't say anything about subscribers. If you're chasing a Shorts views target, like the one in YouTube's 2027 Partner Program rules, this is the one place in our data where more output didn't dilute each piece.
What the platforms say#
Platform guidance on cadence is thinner, older and more contradictory than the advice built on it.
What platforms have said about how often to post
21 Oct 2011
21 Oct 2011
YouTube Creator Playbook: 'a video a week' is typical among successful YouTubers
Source: YouTube Official Blog
13 Aug 2018
13 Aug 2018
YouTube tells NPR it doesn't program to favor people who post more often
NPR's paraphrase of a YouTube statement.Source: NPR via KUNC
21 Nov 2019
21 Nov 2019
Wojcicki: channels had more views on return from a break, on average
Source: YouTube Creator Blog
18 Jun 2020
10 Jun 2021
10 Jun 2021
Mosseri reportedly suggests two feed posts a week and two stories a day
Social Media Today's paraphrase of an Instagram Creator Week session.Source: Social Media Today
8 Oct 2021
8 Oct 2021
TikTok For Business tells advertisers to post 1–4 times a day, then boost
Source: TikTok For Business
16 Dec 2024
16 Dec 2024
Snap: 25 posts a month, on 10 of 28 days, to qualify for monetization
Effective 1 Feb 2025.Source: Snap Newsroom
Checked 27 Oct 2026
Checked 27 Oct 2026
YouTube Help: daily or weekly uploads not needed
Also lists uploading less often among reasons recommendation traffic drops.Source: YouTube Help
YouTube is the most explicit. Asked "Do I need to upload daily or at least once a week?", its Help Center answers: "No, we've done analyses over the years and found that growth in views across uploads is not correlated with time between uploads." Yet the same page lists "Uploading less frequently than usual" among "the most common reasons for drops in traffic from recommendations". Both can be true: the first is about how each upload performs; the second is arithmetic, since fewer new videos means fewer new things to recommend. YouTube's separate upload schedule tips frame the goal around people rather than the algorithm: "A consistent, sustainable release schedule is critical when building and fulfilling audience expectations and maintaining your well-being."
TikTok's best-known number has a different audience: "Aim to post 1-4 times per day to test how different types of content are received. You can then add a paid boost," reads a 2021 TikTok For Business guide for advertisers. We found no TikTok creator guidance with a frequency number. Instagram's Adam Mosseri is widely cited, but only second-hand: Social Media Today reported in 2021 that he suggested two feed posts a week and two stories a day, and RouteNote paraphrased a December 2024 Reel as saying more posting generally means more reach, with a warning about burnout.
Snap is the exception. To qualify for its creator monetization program, Snap requires creators to "Post at least 25 times per month to Saved Stories or Spotlight" and to post to Spotlight or Public Stories "on at least 10 of the last 28 days", along with 50,000 followers and a views threshold. It's a payment rule, not a claim about growth.
What the vendor studies show#
The largest datasets on posting frequency come from companies that sell creator tools. They also find that more posting goes with more growth, and say it isn't proof.
vidIQ grouped 10,210,278 YouTube channels with at least 1,000 subscribers by how often they uploaded from April 2025 to March 2026, Shorts and long-form combined.
vidIQ: channels uploading more grew faster, between channels
Median monthly view growth by uploads per month, 10.2M YouTube channels with 1K+ subscribers, uploads Apr 2025–Mar 2026
| Label | Value |
|---|---|
| Under 1 | 0.53% (subs 0.00%) |
| 1–3 | 0.89% (subs 0.10%) |
| 4–7 | 1.32% (subs 0.39%) |
| 8–11 | 1.70% (subs 0.63%) |
| 12+ | 2.18% (subs 0.91%) |
Source: vidIQ, Jul 2026
Buffer's TikTok study, 11.4 million posts from more than 150,000 accounts, compared accounts with themselves and found more views per post at higher cadence: up to +17% at 2–5 posts a week, +29% at 6–10 and +34% at 11 or more, against one a week. The detail underneath matters more.
On TikTok, posting more lifted the best posts, not the typical one
90th-percentile views per post by posts per week (median in notes), 11.4M TikTok posts from 150K+ accounts, 2025
| Label | Value |
|---|---|
| 1 a week | 3,722 (median 489) |
| 2–5 a week | 6,983 (median 506) |
| 6–10 a week | 10,092 (median 487) |
| 11+ a week | 14,401 (median 459) |
Source: Buffer, Oct 2025
In Buffer's data, posting more bought more draws, not better ones: the typical post didn't improve, but accounts that posted more had more chances at an outlier. On Instagram, Buffer's analysis of 2.1 million posts from 102,000 accounts, again within accounts, found weekly follower growth rates 0.12 percentage points higher than in a zero-post week at 1–2 posts, rising to 0.66 points at 10 or more: more growth, with diminishing returns. Buffer's write-up explains why it compared accounts with themselves: without that, "we can't tell whether frequent posting causes growth, or whether naturally fast-growing accounts just happen to post more."
What it costs creators#
Creators feel the pressure. In Patreon's State of Create survey of 1,007 US creators in August 2024, 75% said "platforms punish those who aren't constantly publishing work", and 78% said "burnout impacts their motivation to be a creator". Other burnout surveys of creators also land high, though they ask different questions of different people, so they read as a range, not a trend. And for most creators, content isn't a big income to begin with, as our post on the creator middle class found.
Burnout surveys of creators land between 52% and 90%
% of creators, by survey; questions and samples differ
| Label | Value |
|---|---|
| Vibely, 2021: ever burned out | 90% (n = 150) |
| Awin, 2022: admit to burnout | 78% (n not given) |
| Patreon, 2024: burnout hurts motivation | 78% (n = 1,007) |
| Creators 4 Mental Health, 2025: experience burnout | 62% (n = 542) |
| Billion Dollar Boy, 2025: burnout from their career | 52% (n = 1,000) |
Sources: Tubefilter (Vibely); Awin; Patreon; Tubefilter (C4MH); Billion Dollar Boy
In the Billion Dollar Boy survey of 1,000 US and UK creators in July 2025, 37% said burnout had led them to consider leaving. No survey we found asks both how often creators post and how burned out they are, so the link between cadence and burnout is unmeasured.
What this means if you make videos#
- Pick a cadence you can keep for a year, not a month. Ten times the uploads went with about 2.3 times the views, and about 4% per doubling carried into the next month. A sprint you can't sustain adds little.
- Add videos only if each one stays good. Each doubling of a month's uploads went with about 12% fewer views per video. Check that the extra videos still get the opening right; our post on the first three seconds shows where viewers leave.
- Batch, so a bad week isn't a break. Record several videos in one session and schedule them, so a busy or sick week doesn't become four weeks of silence (views 19% below comparable channels during the gap). Our free video idea generator can fill a batch's worth of topics in one sitting.
- If you take a break, come back at your old pace. Channels that resumed at 90% or more of their old cadence did best; the median returner managed about half. Have the first few videos finished before you return, and expect a "warm up", as YouTube puts it.
- Keep a rhythm your viewers can learn, but don't fear a missed day. Regular channels grew faster in the same year, but last year's regularity didn't predict this year's views.
- On Shorts, more didn't dilute each video. In our 2025–2026 sample, busier stretches didn't lower views per Short. If Shorts take you little time, more of them is cheap; if they take hours, the long-form trade-off is the better guide.
- Read "post more" studies as "more draws". In Buffer's TikTok data the median post stayed flat while the best posts grew: more posting raised the odds of an outlier, not the typical video.
- Know the platform rules that do exist. Snap's monetization program requires 25 posts a month and posting on at least 10 of the last 28 days. Other cadence numbers you'll hear are advice, often to advertisers, not rules.
We're building ReelsBot, a Mac app that turns raw talking-head clips into a cut, removing retakes, stutters and dead air, with editing by transcript and burnt-in 9:16 captions, because spending less time on each video makes a cadence easier to keep.
Methodology#
Main dataset. YouNiverse (Ribeiro and West, ICWSM 2021, arXiv; Zenodo, CC-BY-4.0) covers 136,470 English-language channels that had more than 10,000 subscribers and more than 10 videos on 27 October 2019, with weekly views, subscribers and uploads from January 2015 to September 2019 (views and subscribers from Social Blade, averaged within the week; uploads from video upload dates, so deleted or private videos are missing). We used January 2016 to September 2019: 4.6 million non-overlapping four-week periods from 133,251 channels, dropping periods with more than 112 uploads (bulk uploaders). Subscriber change is the net change in subscribers, because the dataset's own gain column is clipped at zero. Upload counts matched the per-video metadata closely (correlation 0.991 across channels in 2018), and big channels' subscriber counts matched the public record (PewDiePie at 100.4 million in the week after he passed 100 million).
Within-channel models. Elasticities come from regressions of log views gained (or log subscribers gained) on log uploads, with a fixed effect for each channel and each four-week period and standard errors clustered by channel; periods with no uploads, or with zero or missing view data, are excluded from that model and used as the baseline in the cadence-band model. The lag test adds last and next period's uploads; the momentum model regresses next period's outcome on this period's uploads with this and last period's outcome as controls. Per-video figures use 26.8 million videos uploaded from January 2017 to August 2019 and their lifetime views at the crawl (29 October to 23 November 2019), with channel and period fixed effects.
Breaks. A break is a channel's first run of four or more weeks without an upload after posting in at least 8 of the previous 12 weeks. Each break is compared with channels in the same size band, equally active before, that didn't start a four-week gap in the surrounding weeks. A stricter comparison group, which also required a year of later activity, gives larger gaps but conditions on the future, so we don't headline it. "Resumed cadence" is weekly uploads in the 12 weeks after the return as a share of the channel's pre-break level.
Consistency. For October 2018 to September 2019, regularity is the coefficient of variation of the gaps between a channel's uploads, compared within bands of similar yearly volume. The lag test regresses this year's log views on last year's regularity, with last year's views and both years' uploads as controls.
Shorts. No new data was collected. We reused public Shorts listings gathered on 26 October 2026 for our earlier posts: 134 channels found through YouTube Shorts search with every Short posted from 28 July to 26 October 2026, and 43 more with dated samples. Where two Shorts with known dates bracket a stretch of a listing, we know the exact number of Shorts and days in it; we compared median views per Short across each channel's stretches, controlling for age. Views are rounded public labels.
Outside sources. On 27 October 2026 we re-opened the pages behind the platform, vendor and survey numbers in this post and matched the exact sentence or figure; the two Tubefilter articles were checked from copies saved during research. Mosseri's advice survives only in secondary write-ups, so we don't quote him. Platform figures are the platforms' claims about their own data; vendor figures are the vendors' own analyses.
Limits. Everything here is correlation. Our main sample is survivors (channels that had already reached 10,000 subscribers by October 2019), English, and from long-form YouTube before Shorts; the recommendation system has changed since. Channels that posted a lot and never grew aren't in it, which flatters comparisons between channels more than within them. Views gained include back-catalogue views. We can't see effort per video. The Shorts samples are small, found through search and have no subscriber data.
Open questions#
- How does cadence relate to growth on YouTube today? No open dataset ties 2024–2026 upload cadence to subscriber growth at scale.
- Do more Shorts bring more subscribers, not just views?
- Does cadence work differently for channels that mix Shorts and long-form?
- How much of the per-video drop is lower effort rather than competition between videos?
- What exactly did YouTube's "not correlated" analyses measure?
- Do creators who post more burn out more?
- Would a randomized test or a natural experiment (creators forced to pause by illness or outages) agree with these correlations?
This is the last post in our series on short-form video; it started with State of short-form video 2026.